by Hugh Semple
Neighborhood Democratic Councils (NDCs) are rural local government units in Guyana. They are part of Guyana’s attempt to revive local government after decades of stifling of this level of government for narrow political reasons. One of the challenges facing NDCs is how to keep track of the multiplicity of physical assets under their jurisdictions, plus monitor things like land use, population change, crime and disease patterns, and plan for climate change adaptation. One solution to this problem is to use GIS interactive web map technology. These maps can be used to efficiently provide information to both NDC employees as well as to members of the public.
In this post, I will recount my experience developing a simple interactive map for the Farm Woodlands NDC, Mahaicony in Region 5, Guyana. Some time ago, I visited the NDC and discovered that it was severely lacking in maps of any sort. The main map available was a large, somewhat faded sketch of the boundaries of the NDC and its constituencies. Detailed maps of roads, dams, canals, farmlands, utility lines, etc., were unavailable. The NDC collects rates or property taxes, but the data are stored in large ledgers and there are no maps of property boundaries. Clearly, this NDC was in need of a map makeover. Being a GIS professional, I decided to do something about it.
Building the Interactive Map
I recognized that the NDC needed a full-fledged GIS to help manage local resources. However, in the absence of necessary funding, I decided to build a simple interactive map with a few map layers.
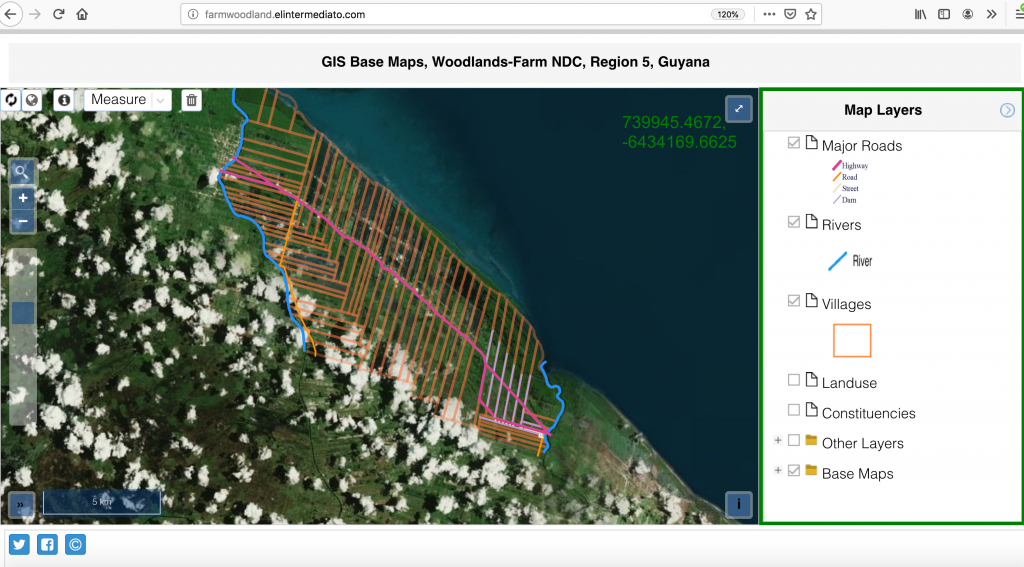
To create the map, I literally took a photograph of the original map with my cell phone camera. Afterwards, I georeferenced the map against a topographic map of the area which I purchased from the Guyana Lands and Survey Department. Next, I digitized village boundaries, constituency boundaries, roads, rivers and canals, and landuse. All map layers were converted to geojson format. Open Street Map and Bing Map served as the base maps for the application. The resolution of the Bing Map’s imagery was very good and the lack of cloud cover allowed clear view of landscape features.
I used the Openlayers API, Version 4.6.5 along with GeoExt to create the interactive map. GeoExt is based on ExtJS and OpenLayers and provides tools for rapidly creating web mapping sites. I now have a fully functioning web mapping application. A pic of the interactive map that I created is shown below. The actual application can be found here.
Prototype
I will eventually clean up the code for the application and update the user interface. However, the application was not written to be a production application. Rather, it was written to serve as a prototype to illustrate what can be quickly done to help NDCs make digital maps more accessible to local decision makers and to communities as a whole. The application has been written in such a way that the code is easily re-usable. Another NDC wishing to use the application can simply copy the code, make a few edits, recenter the base maps, and develop their own vector maps for their NDCs. I urge NDCs to start developing their own web applications.
Conclusion
NDCs are important local government units in Guyana and with time, Guyanese are becoming more accustomed to their presence and role in the provision of government services. Similar to local government units in other parts of the world, NDCs in Guyana should utilize geographic information systems to better manage infrastructure and certain services. Web applications represent a good way to keep track of the location and other characteristics of infrastructure and to share this information with NDC workers and members of the public. This post highlights an example of a simple web application that can be quickly developed by NDCs to share spatial data. Other, platforms are also available, including ones that do not require coding skills, e.g., ArcGIS Online. Regardless of the platform utilized, I think each NDC should start thinking about how best to start developing and working with spatial data about their jurisdiction.