by Hugh Semple
Guyana has one city, the capital Georgetown, and nine towns (Table 1). For a variety of purposes, planners and scholars often wish to understand how socioeconomic and demographic variables are geographically distributed within these urban spaces. Such variables include population , disease, crime mapping, income poverty mapping, etc. While this is a routine activity in many urban places around the world, it is very time-consuming activity in Guyana because the map files are not available in a format that allows them to easily joined to tabular data. A dire need exists for appropriate shapefiles to be distributed with relevant demographic tables in the next census.
Table 1. Main Urban places in Guyana
| Urban Place | Population |
| Georgetown | 134,497 |
| Linden | 29,298 |
| New Amsterdam | 17,033 |
| Anna Regina | 12,391 |
| Corriverton | 11,494 |
| Bartica | 7,423 |
| Rosehall | 3,583 |
| Mahdia | 1,617 |
| Lethem | 1, 158 |
| Mabaruma | 800 |
Data Requirements for intra-urban thematic mapping
For urban thematic mapping, we require detailed geographic data about urban places. In particular, we require each urban place to be sub-divided into smaller spatial units and that population totals be available for each of these small units. Once the spatial and demographic datasets are assembled, we can enter the number of events such as crime, disease, etc, per spatial unit, calculate rates, and map distributions within the urban areas.
On the Guyana Statistics Bureau’s website, one can download village level data by population and households. These village level datasets contain demographic data that can be used for local-level mapping. Although the spatial units are called villages, they are not actually all villages, as many communities within urban areas are also included in this file. For example, 60 communities located in Georgetown are included in the file. Communities include Kitty, Kingston, Prashad Nagar, Campbellville, Albouystown, etc. Eighteen Linden communities are included in the file, including Kara Kara, Rainbow City, Retrieve, etc. Perhaps, the Statistics Bureau may want to change this method of labeling.
One positive aspect of these spatial units for sub-national mapping is that because they are well-defined communities, people can quickly relate to them geographically. This makes map interpretation relatively easy. Also, the boundaries of these units are stable thus making them good for geo-demographic analysis across different time periods. Finally, average population for all villages in the files is 584 persons, and just under 2,000 persons for the spatial units in Georgetown. These relatively small populations means that the spatial units allow for very targeted mapping.
Mapping Community-Level Population Distribution in Georgetown
While demographic data for “villages” are available, the village polygons shapefiles are not published by the Statistics Bureau. This makes it extremely difficult to conduct thematic mapping, and is perhaps, the main reason why thematic mapping is not widely done in Guyana.
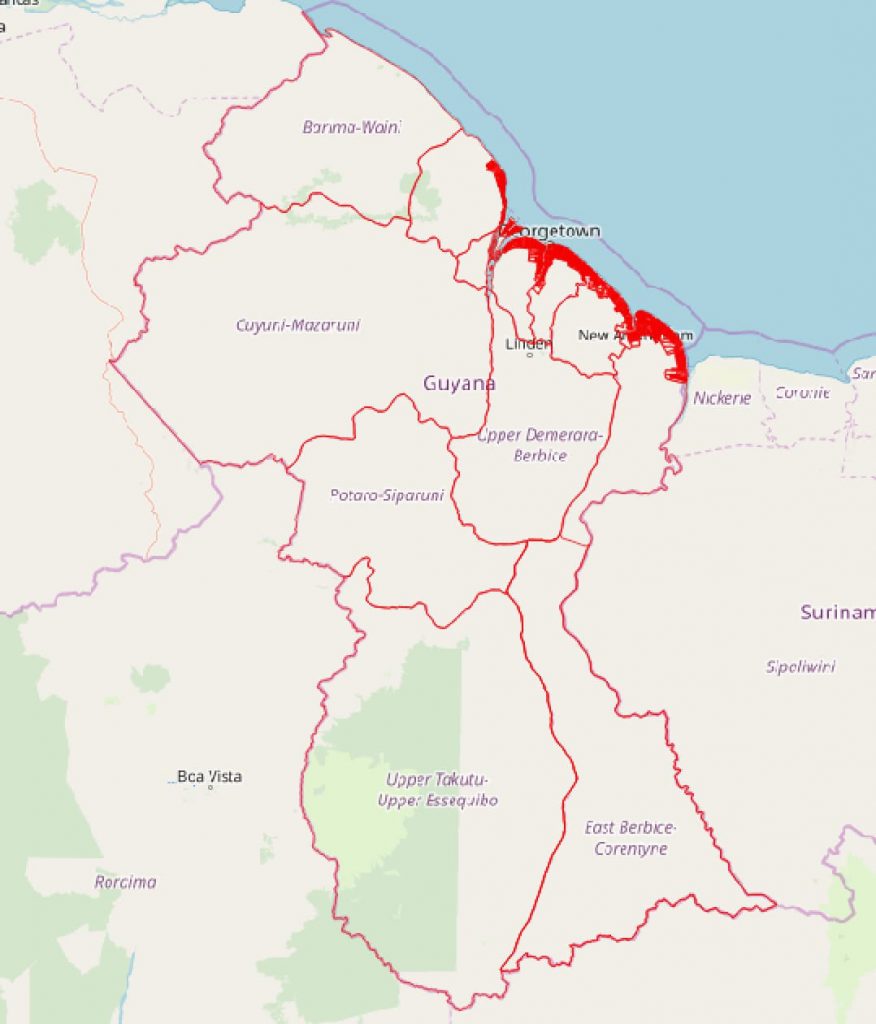
At GuyNode.com we have started developing village level base maps for Guyana that can be used for thematic mapping. We have completed and posted a village level shapefile for Region 5 and are near completing one for all the other coastal regions. As part of this project, we recently digitized communities within the City of Georgetown (Figure 1). We also attributed this polygon shapefile with population data. The figure below shows unnormalized population distribution for Georgetown.
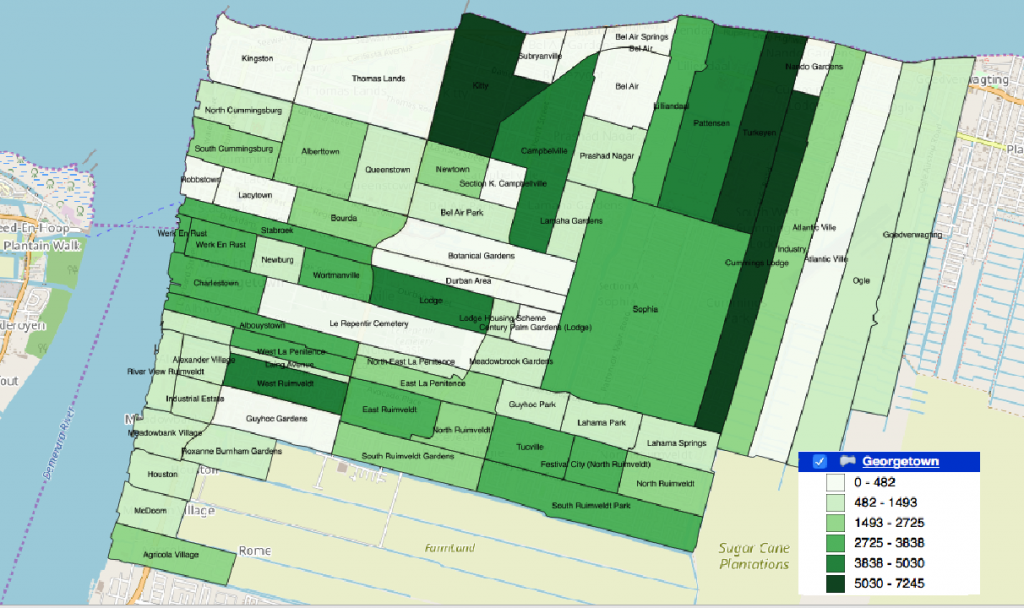
Each spatial unit in the map above is listed as a ‘village’ in the census population file. However, determining the exact boundaries of these units is difficult because the Statistics Bureau has not published map files of these districts. In the absence of the necessary geographic files from the Statistics Bureau, we used Google Map, Bing Map and available documents to determine the boundaries of these areas. We believe that we have a fairly good representation of the boundaries of these communities. However, only the Statistics Bureau can produce a definitive map of the urban communities listed in their census demographic tables.
After digitizing the spatial units shapefile, we converted the pdf demographic table into Excel format, edited it, and then joined the table to the spatial units shapefile. Following this, we were able to map population distributions, as shown on the map in Figure 1.
Need for A Geocoding Infrastructure
The availability of a community level polygon map for Georgetown is a significant step forward for thematic mapping in the city. GIS users are now in a position to quickly map and analyze socio-economic variables such as disease, crime, poverty and income. Also, with population data available for these units, we can calculate rates for the various communities. Various types of advanced cluster mapping can also be performed to allow for better targeting of crime, diseases, poverty, etc.
Despite the availability of the spatial units map for Georgetown, one problem that remains is the inability to perform geocoding to arrive at points counts for communities. For example, if we are performing crime mapping, we would like to record the addresses where the crime events occurred in a spreadsheet. Next, we would like to convert the addresses into a set of points through geocoding. Finally, we would like to get a count of the points by communities, or create polygon-based thematic maps from these counts.
As far as I can tell, local street centerlines files to permit point geocoding are not available, thus this type of geocoding is not an option at this stage. Fortunately, if the community name is available for each event, then GIS software can still geocode by community names. However, instead of generating geocoded points, the software will provide community totals, which can be used for thematic mapping.
The Statistics Bureau
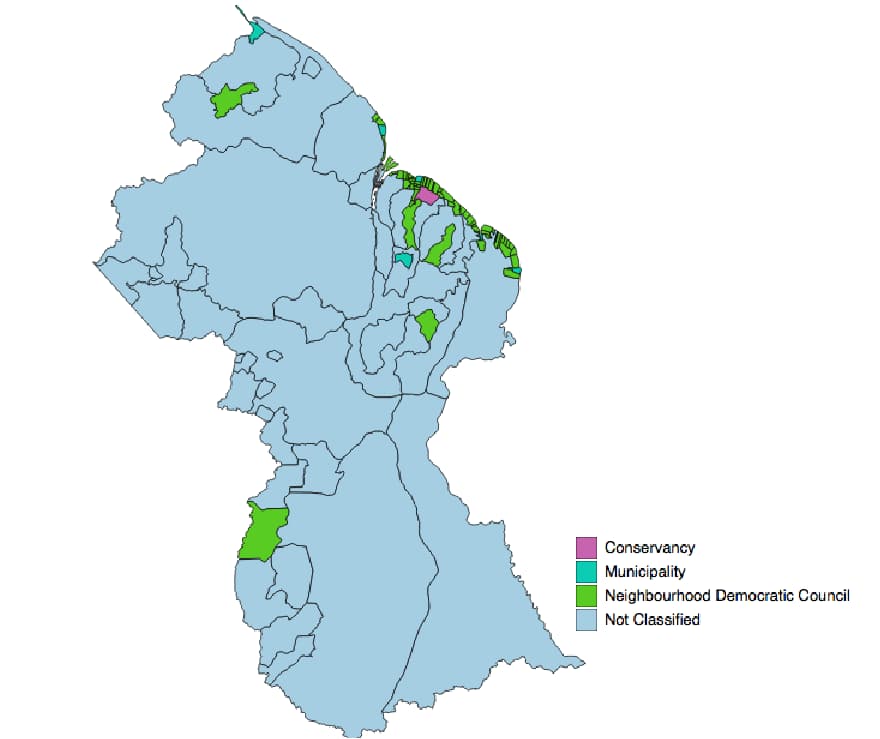
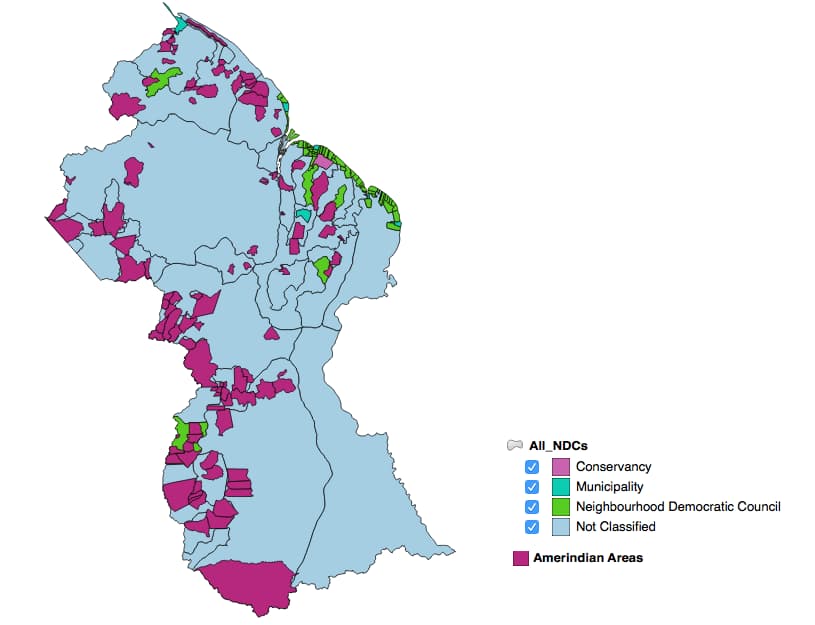
The Statistics Bureau needs to start publishing better quality map files to support the visualization of its demographic data. Currently, the Bureau publishes map files in MapInfo format, which is not a popular format for sharing spatial data. In addition, the Bureau only publishes map files at the Regional and NDCs levels. Village level map files are not published, despite large amounts of data being published at the village level.
In the US, the Census Bureau was the original provider of street centerlines files. The Statistics Bureau in Guyana should work with the Lands and Survey Department to sponsor the creation of street centerline shapefiles for all the major urban places in Guyana, indeed for all villages in Guyana.
Conclusion
Guyana has made some tentative steps at entering the world of digital mapping. However, too little is being done in the area of national spatial data handling. Consequently, the many benefits of the digital mapping revolution is thus lost to the nation. Fortunately, Guyana is a small country and a new commitment by the Statistical Bureau to publish relevant maps to support tabular census data could make a huge difference in terms of mapping of socio-economic datasets. In the meantime, GIS users can download required data from guynode.com.