Rapid thematic mapping is one of the fundamental aspects of GIS. Thematic maps allows us to quickly visualize data based on some administrative or spatial unit. Despite the known simplicity of creating thematic maps when using GIS software, there are still many data and other challenges to thematic mapping in Guyana. This blog describes some efforts by GuyNode to advance thematic mapping at the RDC, NDC and village levels in Guyana.
Thematic Mapping at the RDC Level
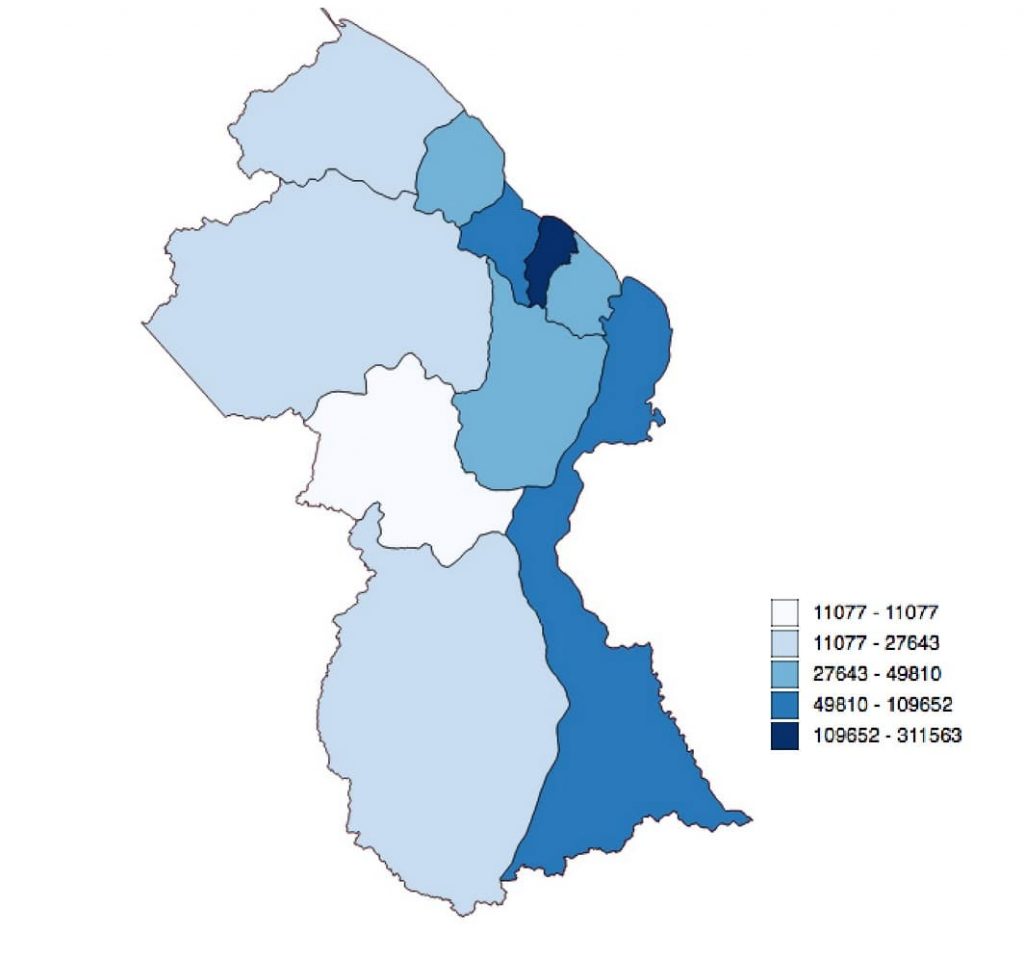
Currently, it is very easy to obtain shapefiles of the ten administrative regions of Guyana. Various websites carry these files including GuyNode and GADM. This means that one can easily create thematic maps by regions by entering population data into the attribute table of shapefiles of the region and then mapping the data using an appropriate classification technique and color scheme.
Population data by Regional Democratic Councils (RDCs) are available at the Guyana Bureau of Statistics‘ website. The data can be downloaded, processed, and entered into the attribute table of the shapefile. Using the population data as a base, rates for different events can be calculated for each region and mapped accordingly. GuyNode.com has sought to improve regional level thematic mapping by entering population data for each region for several census years into its regional shapefile. This means that rates calculations can be accomplished very easily.
Mapping by administrative regions allows us to see broad regional patterns at a glance(Figure 1). However, administrative regions are very large geographic units and thematic mapping at this geographic level does not not allow us to detect variations at the NDCs and village levels.
Thematic Mapping at the NDC Level
Thematic mapping at the level of Neighborhood Democratic Councils (NDCs) allows us to see more detailed geographic patterns and enables better spatial targeting for economic and social policy implementation. NDC vector files are available on the Internet for free downloads. One source is the GADM. Another source is the Guyana Bureau of Statistics. Some NDC boundaries in the GADM shapefile need adjusting. As for the Statistics Bureau’s dataset, their vector files are in MapInfo format and will need conversion to shapefile format if you are not using MapInfo software. I strongly suggest that the Statistics Bureau distribute its RDC and NDC map files in shapefiles format rather than Mapinfo format, as shapefiles are far more popular for file sharing.
NDC shapefiles can also be found at GuyNode’ website. GuyNode has updated the geometry of the Statistic Bureau’s file as well as entered the population totals for the last census. This allows for speedy rate calculations for thematic mapping.
One issue with mapping at the level of NDCs is that these units do not cover the entire geographic extent of Guyana. NDCs are actually rural local government units so they must be combined with maps of the various towns and the city of Georgetown to obtain better sub-regional coverage. Even so, large parts of administrative regions are not under local government and are labeled “Not Classified”.
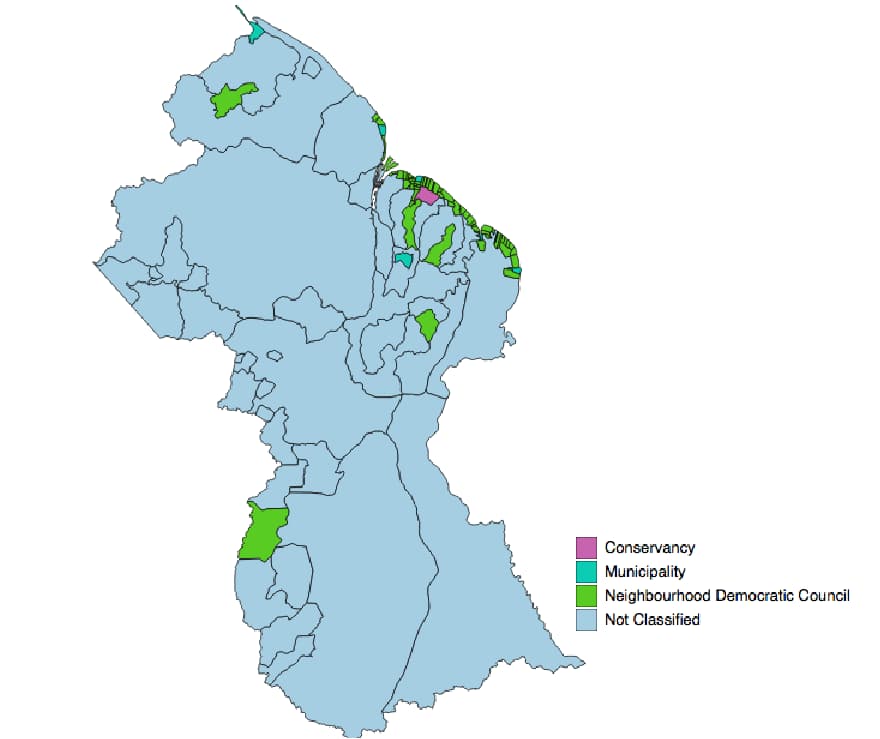
As seen in the illustration above, from a visualization standpoint, these large “Not Classified” areas dominate the NDC thematic map and can create misconceptions when viewing geographic patterns. This is because the ‘Not Classified’ regions are the single most obvious units on the map. Unclassified areas also prevent important spatial patterns from being detected in the NDCs unless, one zooms in to these locations.
One way to deal with this situation is to prepare separate thematic maps for each region. This allows spatial patterns to be detected easily even if the maps are static paper maps.
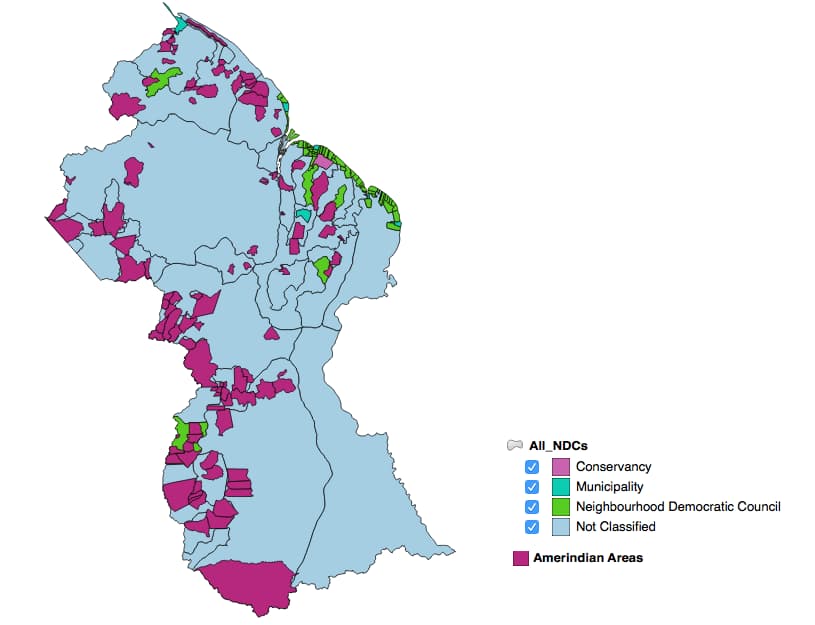
Combining NDCs with Amerindian Areas for Thematic Mapping
When mapping neighborhood democratic councils, it might also be useful to consider including Amerindian areas. Although Amerindian areas are not NDCs, they are similar in concept, as they are larger than coastal villages but smaller than regional democratic councils. The map below shows Amerindian areas combined with NDCs. A map based on these combined spatial units can make for better visualization of sub-regional spatial patterns.
Thematic Mapping at the Village Level
Creating thematic maps by villages has its own challenges. First, until recently, village level polygon shapefiles have been hard to locate. The GuyNode Spatial Data Infrastructure project has sought to rectify this problem by digitizing a coastal village level polygon shapefile for Guyana (Figure 3). This layer is still being attributed and will be posted shortly.
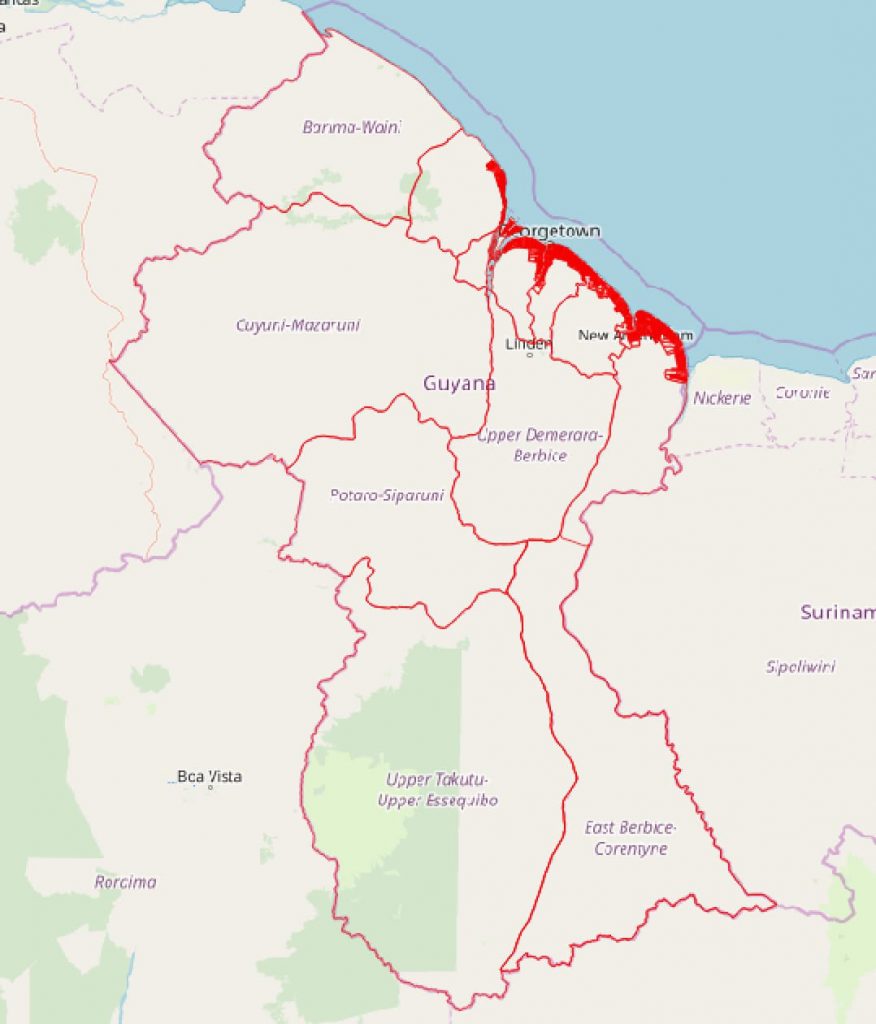
As can be seen in the figure above, the coastal villages occupy only a small part of the country thus, for effective visualization, it is best to create village thematic maps for each NDC or RDC. This will allow spatial patterns to be detected easily compared to displaying a village level map for the entire country.
Figure 4, Villages, Region 5.
One advantage of thematic mapping at the coastal village level is that the villages are relatively small and have stable boundaries. This means that they can be used for studying patterns over different census periods without having to worry about the changes in the size of mapping units. This is a common problem when dealing with census tracts whose boundaries are subject to change.
Conclusion
In the US, spatial units such as census tracts, census blocks and block groups are the basis for thematic mapping. One advantages of using these units is that demographic data are published for these units, so, with the use of simple table joins, demographic data can be linked to the census geography units for mapping. Secondly, regardless of the size and shape of administrative units, we can clip census tracts or census blocks files to the extent of these units.
Guyana does not have a census geography system consisting of census tracts and census blocks. Enumeration districts are the basic census geography unit and census data is distributed based on administrative units such as RDCs , NDCs, and villages. Since villages are relatively small and their boundaries are not likely to change over time, these units can play an important part in thematic mapping in Guyana.
PS. You can download maps and demographic tables from GuyNode’s website for thematic mapping in Guyana.